


Reports and dashboard module
Track sales and profitability from the dashboard and reports
Sales, operations and finance teams and managers use dashboards suited to their roles, and each user picks their widgets and arranges them by drag and drop. In the report center, you review sales, profitability and agent reports with period comparison. Site analytics appears in the panel without depending on Google.
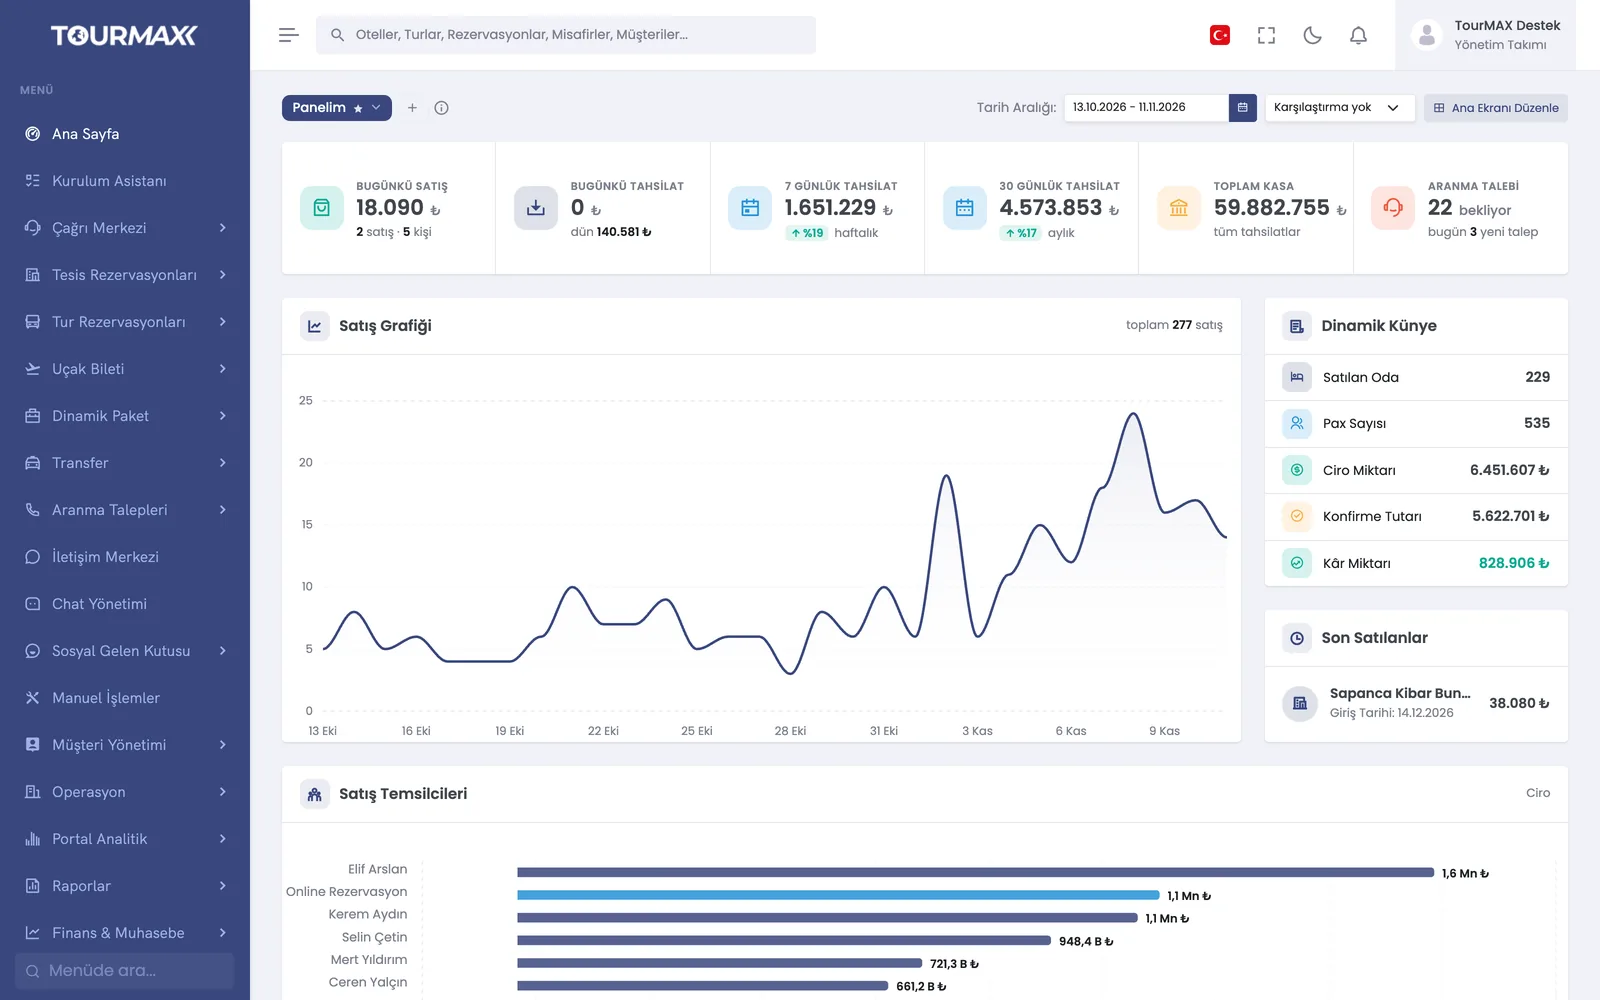 Real screensDashboard: daily sales and collection widgets, sales chart and revenue by agent
Highlights of the Reports and Dashboard module
27 widgets for sales, operations, finance and the call center; drag-and-drop layout, comparison period and role-based widget access. Every user can create more than one dashboard and switch between them; the number of dashboards per user depends on the plan: Starter 1, Standard and Professional 3, Premium 5, Enterprise unlimited.
5 product tabs; breakdown by sales source (online, agent, panel) and market; more than 30 sort options; profit, net profit and profitability columns; Excel and PDF export.
Period comparison and 8 charts; the sales date axis can be set to booking, payment or check-in date.
Sales, conversion and cancellations by agent; team comparison.
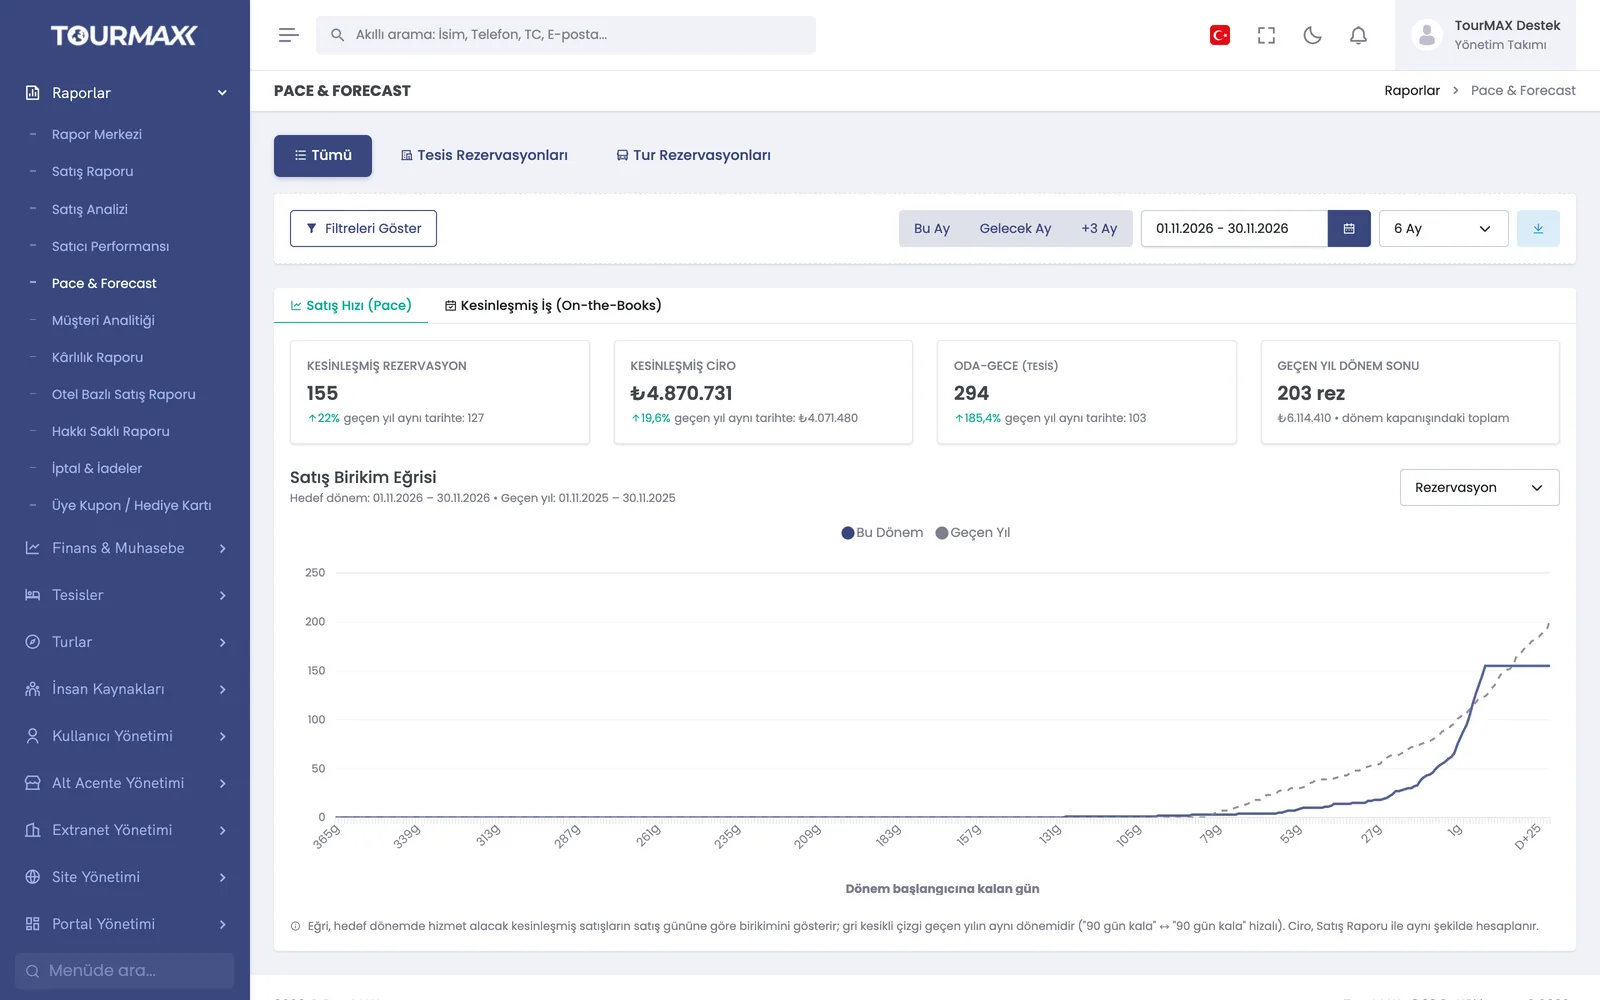
The accumulation curve of confirmed bookings is compared with the same period last year, so you can see early on where the season is heading.
Repeat customer rate, customer value and demographics; net profit, margin distribution and product scorecard.
Refund report by cancellation reason and by staff member; member coupon and gift card report.
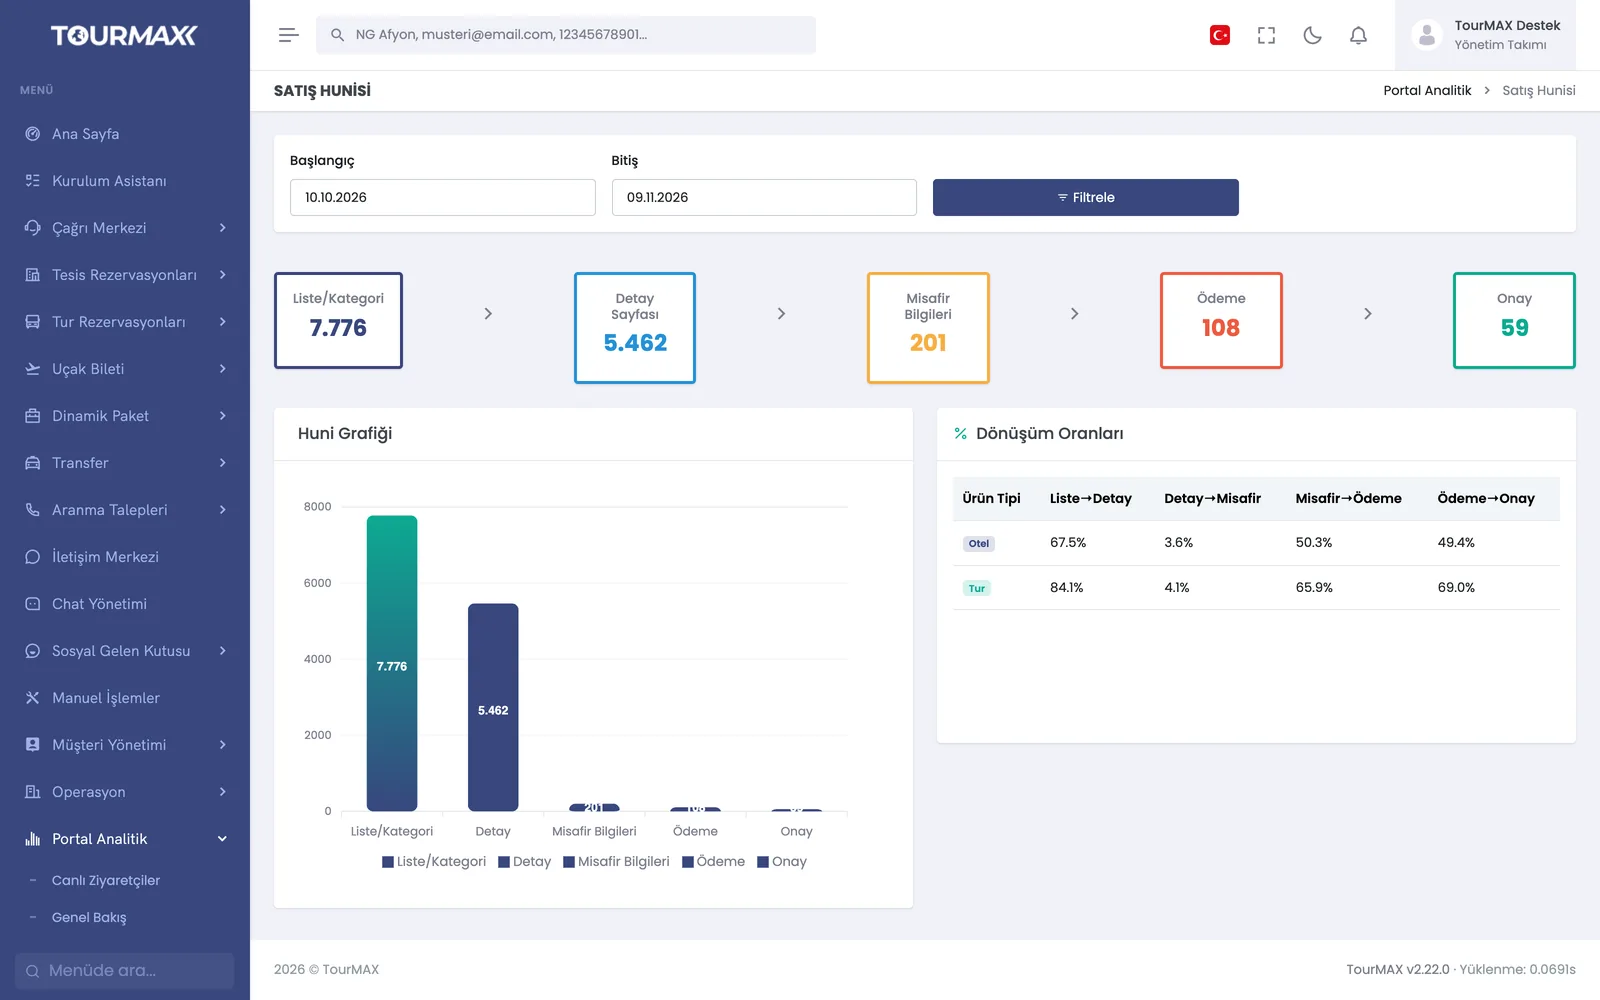
Live visitors, product and category performance, sales funnel, traffic sources and UTM; your own IP addresses can be excluded. Data is collected without depending on Google Analytics.
Step-by-step workflow
In the widgets you choose for your role, see yesterday’s sales, pending property confirmations and missed calls.
Open the sales analysis, agent scorecard or pace report from the report center.
Choose the columns you want with the column manager, and share the report as Excel or PDF.
Reports and Dashboard by plan
Items marked as add-ons can be added separately to lower plans; add-ons are billed monthly. You can find the plan comparison and add-on prices on the pricing page.
Integrations this module uses



Frequently asked questions about Reports and Dashboard
Does every user see the same dashboard?
Where do the profit figures come from?
Which plan includes it?
Modules it works with
Accounting and Finance
Collections, POS, e-invoice, e-archive invoice and tax return preparation
Learn more →Customer Management
Track booking, payment and conversation history from the customer card
Learn more →Booking Website
A booking website without writing code: 5 languages, 17 currencies, online payment
Learn more →